



“Buoyed by the enthusiastic response to our Dodge and Jeep EV Days over the summer, and our Q3 global BEV sales increasing 41% year-over-year, we are executing our Dare Forward 2030 electrification roadmap at a fast pace to meet the strong demand for electrified vehicles. We look forward to CES 2023 in January in Las Vegas, where the Ram 1500 Revolution BEV Concept will make its worldwide debut.”
Richard Palmer, CFO
| RESULTS FROM CONTINUING OPERATIONS | ||||||||||||||||
| Q3 2022 | Q3 2021 | Q3 2022 vs. Q3 2021 |
YTD 2022 | YTD 2021 Pro Forma(2) |
YTD 2022 vs. YTD 2021 Pro Forma(2) |
YTD 2021 | ||||||||||
| Combined shipments (000 units) |
1,334 | 1,176 | +13% | 4,367 | 4,450 | (2)% | 4,356 | |||||||||
| Consolidated shipments (000 units) |
1,281 | 1,131 | +13% | 4,215 | 4,302 | (2)% | 4,210 | |||||||||
| Net revenues (€ billion) |
42.1 | 32.6 | +29% | 130.1 | 107.9 | +21% | 105.2 | |||||||||
| FY 2022 GUIDANCE – CONFIRMED
Adjusted Operating Income Margin(3)
Industrial Free Cash Flows(4)
|
2022 INDUSTRY OUTLOOK(5)*
North America -8% Enlarged Europe -12% Middle East & Africa Stable South America Stable India & Asia Pacific +5% China +5% (from Stable) *2022 Industry Outlook changed for China compared to outlook provided on July 28 ’22 |
|||||||||||||||
Basis of preparation: All reported data is unaudited. “Q3 2022”, “Q3 2021”, “YTD 2022” and “YTD 2021” represent revenues as reportable under IFRS. YTD 2021 includes Legacy FCA from January 17, 2021, following the closure of the Merger; “YTD 2021 Pro Forma” is presented as if the Merger had occurred January 1, 2020 and include results of FCA for the period January 1 – 16, 2021. Refer to the section “Notes” for additional detail. Reference should be made to the section “Safe Harbor Statement” included elsewhere within this document.
AMSTERDAM, November 3, 2022 – As global sales of Stellantis’ battery electric vehicles (BEVs) increased 41% y-o-y to 68k units, and sales of low emission vehicles rose 21k units y-o-y to 112k vehicles in Q3 2022, the Company continued to execute its bold electrification plans and progress towards achieving its Dare Forward 2030 strategic plan goals.
Offering best-in-class fully electrified vehicles: Jeep® brand announced its plan to become the global leader in SUV electrification, bringing four all-electric SUVs to North America and Europe by 2025, supporting Stellantis’ carbon net zero ambition. The announcement came just weeks after Dodge took a giant step forward on the performance brand’s road to an electrified future, revealing the Dodge Charger Daytona SRT, a concept that reimagines what a BEV can be.
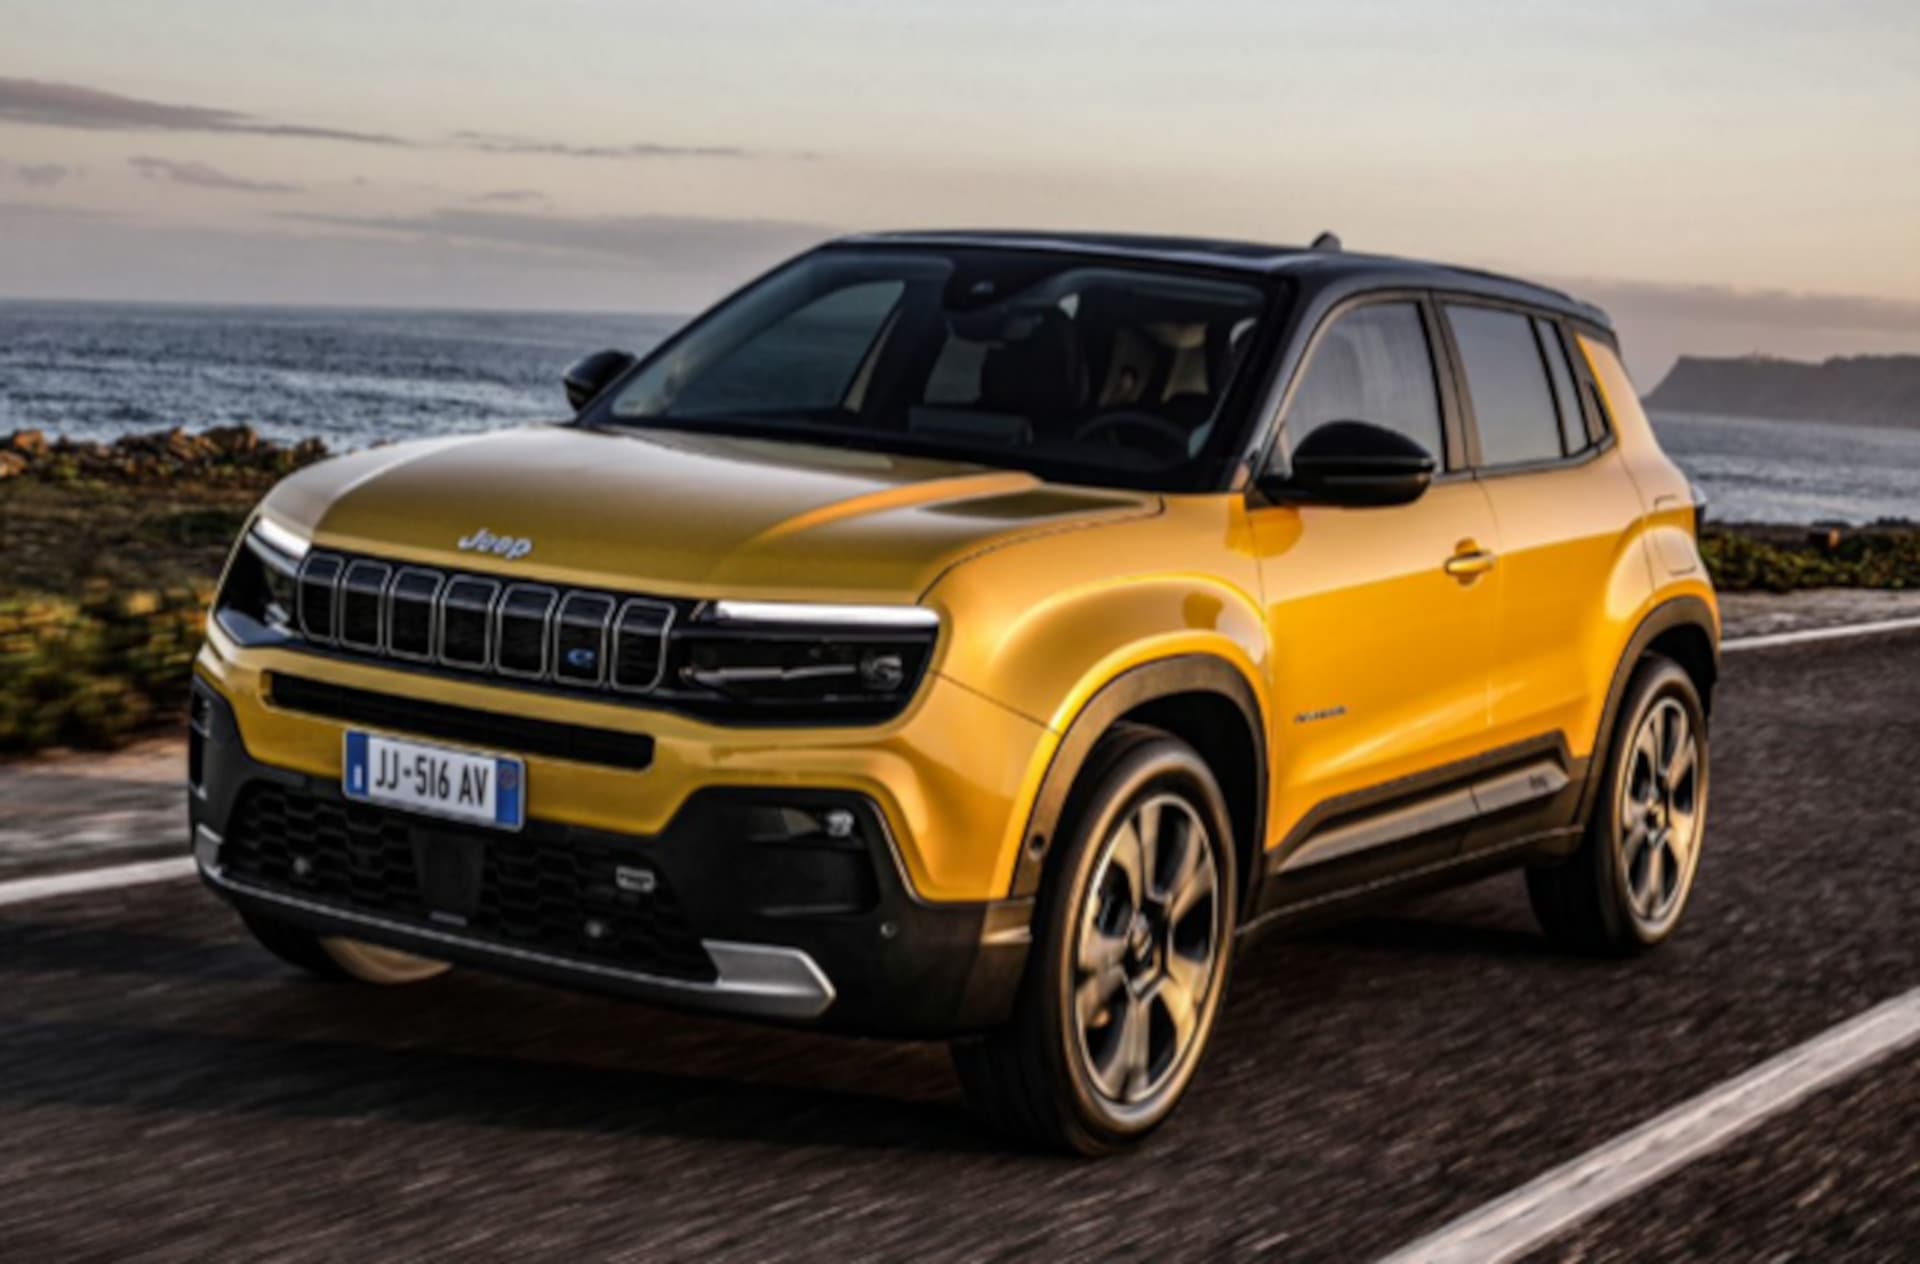
Executing on its plan to become the global leader in SUV electrification, the Jeep brand unveiled the all-new Jeep Avenger, the brand’s first-ever BEV, at the 2022 Paris Motor Show, with pre-booking for the 1st Edition beginning the same day.
To meet the growing demand for electrified vehicles, Stellantis announced a new agreement with joint venture partner Punch Powertrain to increase production of the future-generation electrified dual-clutch transmissions (eDCT) for Stellantis hybrid and plug-in hybrid electric vehicles. The eDCTs, which will be built at Stellantis’ Mirafiori Complex in Turin, Italy, will complement the existing capacity in Metz, France.
Investing in a Circular Economy: The Mirafiori Complex will also be home to Stellantis’ first Circular Economy Hub, starting with three activities for the sustainable use of vehicles and parts: vehicle reconditioning, vehicle dismantling, and parts remanufacturing. The Hub will open in 2023.
Building the roadmap for the future of mobility: Stellantis revealed that it has built one of the biggest and widest collaborative ecosystems in the world, with more than 160 co-funded projects and over 1,000 different partners worldwide. The projects align with Stellantis’ strategic technical domains, which include autonomous driving, connectivity, manufacturing, electrification technologies and advanced propulsion.
Segments (all market share and ranking references are for Q3 2022): North America: Market share of 10.8%, down 20 bps y-o-y, with U.S. share down 70 bps to 11.1%. Enlarged Europe: EU30 market share of 19.2%, down 90 bps y-o-y. South America: Market leader with 22.6% share, down 150 bps y-o-y. Commercial Vehicles market leader in South America and EU30, with 30.8% and 29.2% share, respectively.
Maserati: The all-new Grecale, which launched in June 2022, continues to attract a whole new audience. In 2023, one of the brand’s icons returns: the all-new GranTurismo with Nettuno engine and the GranTurismo Folgore, the first BEV in the brand’s history. Maserati will follow up with the all-new Grecale Folgore in mid-2023 and the all-new GranCabrio, available in internal combustion engine and Folgore models.
Upcoming Event: January 5: Ram Revolution electrification and technology event at CES 2023 in Las Vegas
On November 3, 2022 at 1:00 p.m. CET / 8:00 a.m. EDT, a live audio webcast and conference call will be held to present Stellantis’ Third Quarter 2022 Shipments and Revenues. The audio webcast and recorded replay will be accessible under the Investors section of the Stellantis corporate website at www.stellantis.com. The presentation material is expected to be posted under the Investors section of the Stellantis corporate website at approximately 8:00 a.m. CET / 3:00 a.m. EDT on November 3, 2022.
About Stellantis
Stellantis N.V. (NYSE / MTA / Euronext Paris: STLA) is one of the world’s leading automakers and a mobility provider. Its storied and iconic brands embody the passion of their visionary founders and today’s customers in their innovative products and services, including Abarth, Alfa Romeo, Chrysler, Citroën, Dodge, DS Automobiles, Fiat, Jeep®, Lancia, Maserati, Opel, Peugeot, Ram, Vauxhall, Free2move and Leasys. Powered by our diversity, we lead the way the world moves – aspiring to become the greatest sustainable mobility tech company, not the biggest, while creating added value for all stakeholders as well as the communities in which it operates. For more information, visit www.stellantis.com
Contacts: [email protected] or [email protected]
SEGMENT PERFORMANCE
| NORTH AMERICA | ||||||
|
Q3 2022 |
Q3 2021 | vs. Q3 2021 |
|
YTD 2022 | YTD 2021 Pro Forma(2) |
|
| Shipments (000s) |
441 | 394 | +47 | 1,400 | 1,267 | |
| Net revenues (€ million) |
21,071 | 15,532 | +5,539 | 63,514 | 47,979 | |
| ENLARGED EUROPE | ||||||
| Q3 2022 | Q3 2021 | vs. Q3 2021 |
|
YTD 2022 | YTD 2021 Pro Forma(2) |
|
| Shipments (000s) |
538 | 470 | +68 | 1,900 | 2,134 | |
| Net revenues (€ million) |
13,486 | 11,622 | +1,864 | 44,805 | 43,662 | |
| MIDDLE EAST & AFRICA | ||||||
| Q3 2022 | Q3 2021 | vs. Q3 2021 |
|
YTD 2022 | YTD 2021 Pro Forma(2) |
|
| Combined shipments (000s) |
87 | 73 | +14 | 286 | 273 | |
| Consolidated shipments (000s) |
52 | 49 | +3 | 190 | 187 | |
| Net revenues (€ million) |
1,324 | 1,045 | +279 | 4,363 | 3,592 | |
| SOUTH AMERICA | ||||||
| Q3 2022 | Q3 2021 | vs. Q3 2021 |
|
YTD 2022 | YTD 2021 Pro Forma(2) |
|
| Shipments (000s) |
213 | 185 | +28 | 616 | 609 | |
| Net revenues (€ million) |
3,965 | 2,546 | +1,419 | 11,198 | 7,482 | |
| CHINA AND INDIA & ASIA PACIFIC | ||||||
| Q3 2022 | Q3 2021 | vs. Q3 2021 |
|
YTD 2022 | YTD 2021 Pro Forma(2) |
|
| Combined shipments (000s) |
48 | 48 | — | 148 | 150 | |
| Consolidated shipments (000s) |
30 | 27 | +3 | 92 | 88 | |
| Net revenues (€ million) |
1,138 | 949 | +189 | 3,290 | 2,832 | |
| MASERATI | ||||||
| Q3 2022 | Q3 2021 | vs. Q3 2021 |
|
YTD 2022 |
YTD 2021 Pro Forma(2) |
|
| Shipments (000s) |
6.6 | 5.8 | +0.8 | 16.8 | 16.6 | |
| Net revenues (€ million) |
630 | 514 | +116 | 1,571 | 1,399 | |
Reconciliations
Net revenues from external customers to Net revenues and Net revenues from external customers to Pro Forma Net revenues
| Results from continuing operations | |||||||||
| Q3 2022 | (€ million) | NORTH AMERICA |
ENLARGED EUROPE |
MIDDLE EAST & AFRICA |
SOUTH AMERICA |
CHINA AND INDIA & ASIA PACIFIC |
MASERATI | OTHER(*) | STELLANTIS |
| Net revenues from external customers |
21,070 | 13,467 | 1,324 | 3,978 | 1,136 | 631 | 495 | 42,101 | |
| Net revenues from transactions with other segments |
1 | 19 | — | (13) | 2 | (1) | (8) | — | |
| Net revenues | 21,071 | 13,486 | 1,324 | 3,965 | 1,138 | 630 | 487 | 42,101 | |
(*) Other activities, unallocated items and eliminations
| Results from continuing operations | |||||||||
| Q3 2021 | (€ million) | NORTH AMERICA |
ENLARGED EUROPE |
MIDDLE EAST & AFRICA |
SOUTH AMERICA |
CHINA AND INDIA & ASIA PACIFIC |
MASERATI | OTHER(*) | STELLANTIS |
| Net revenues from external customers |
15,532 | 11,600 | 1,045 | 2,541 | 944 | 514 | 375 | 32,551 | |
| Net revenues from transactions with other segments |
— | 22 | — | 5 | 5 | — | (32) | — | |
| Net revenues | 15,532 | 11,622 | 1,045 | 2,546 | 949 | 514 | 343 | 32,551 | |
(*) Other activities, unallocated items and eliminations
| Results from continuing operations |
|||||||||
| YTD 2022 | (€ million) | NORTH AMERICA |
ENLARGED EUROPE |
MIDDLE EAST & AFRICA |
SOUTH AMERICA |
CHINA AND INDIA & ASIA PACIFIC |
MASERATI | OTHER(*) | STELLANTIS |
| Net revenues from external customers |
63,512 | 44,742 | 4,363 | 11,211 | 3,286 | 1,574 | 1,412 | 130,100 | |
| Net revenues from transactions with other segments |
2 | 63 | — | (13) | 4 | (3) | (53) | — | |
| Net revenues | 63,514 | 44,805 | 4,363 | 11,198 | 3,290 | 1,571 | 1,359 | 130,100 | |
(*) Other activities, unallocated items and eliminations
| Results from continuing operations |
|||||||||
| YTD 2021 Pro Forma |
(€ million) | NORTH AMERICA |
ENLARGED EUROPE |
MIDDLE EAST & AFRICA |
SOUTH AMERICA |
CHINA AND INDIA & ASIA PACIFIC |
MASERATI | OTHER(*) | STELLANTIS |
| Net revenues from external customers(A) |
45,952 | 43,104 | 3,556 | 7,283 | 2,766 | 1,377 | 1,123 | 105,161 | |
| Add: FCA Net revenues from external customers, January 1 – 16, 2021(B) |
2,015 | 335 | 36 | 189 | 51 | 18 | 60 | 2,704 | |
| Add: Pro Forma adjustments(C) |
3 | (7) | — | — | — | — | — | (4) | |
| Pro Forma Net revenues from external customers, January 1 – September 30, 2021 |
47,970 | 43,432 | 3,592 | 7,472 | 2,817 | 1,395 | 1,183 | 107,861 | |
| Net revenues from transactions with other segments |
9 | 230 | — | 10 | 15 | 4 | (268) | — | |
| Pro Forma Net revenues(D) |
47,979 | 43,662 | 3,592 | 7,482 | 2,832 | 1,399 | 915 | 107,861 | |
Comments
Newest firstLoading comments…