



- Motorists keeping cars longer: average car now 7.44 years old, up two months on a year ago.
- Past decade saw UK car parc grow 9%, a slower rise than the previous decade’s 17%.
- Fuel efficiency demand sees diesels take a record 50.6% market share in 2011 with fewer petrol cars on UK roads than at any time since 1988.
- Average new car 20% more efficient than UK’s average age car.
- In 2011, the total number of cars on UK roads grew 104,519 units (0.3%) to 31,362,716.
Recession has changed the shape of the UK’s car parc according to new figures released today by the Society of Motor Manufacturers and Traders (SMMT). Over the last 10 years, the total number of cars on UK roads (parc) has grown 9%, but that is a slower rate than the previous decade which recorded a 17% rise.
To the end of last year, the total parc increased to 31,362,716, up on 2010 by 104,519 units (0.3%). The average car on UK roads is now 7.44 years old, around two months older than a year ago, suggesting cash strapped motorists are keeping cars for longer.
However, this could be a false economy as the average new car is 20% more efficient than a typical seven year old car, saving the average motorist around £400 each year. In the average car’s lifetime, it will have four owners, but there are 341 cars on UK roads with more than 20 registered keepers, and more than 5.3 million cars over 12 years old.
The data comes from the SMMT’s largest ever annual Motorparc census that analyses full details including make, model, variant, colour, emissions and age of every car, van, truck, bus and coach on UK roads.
Fuel efficient nation
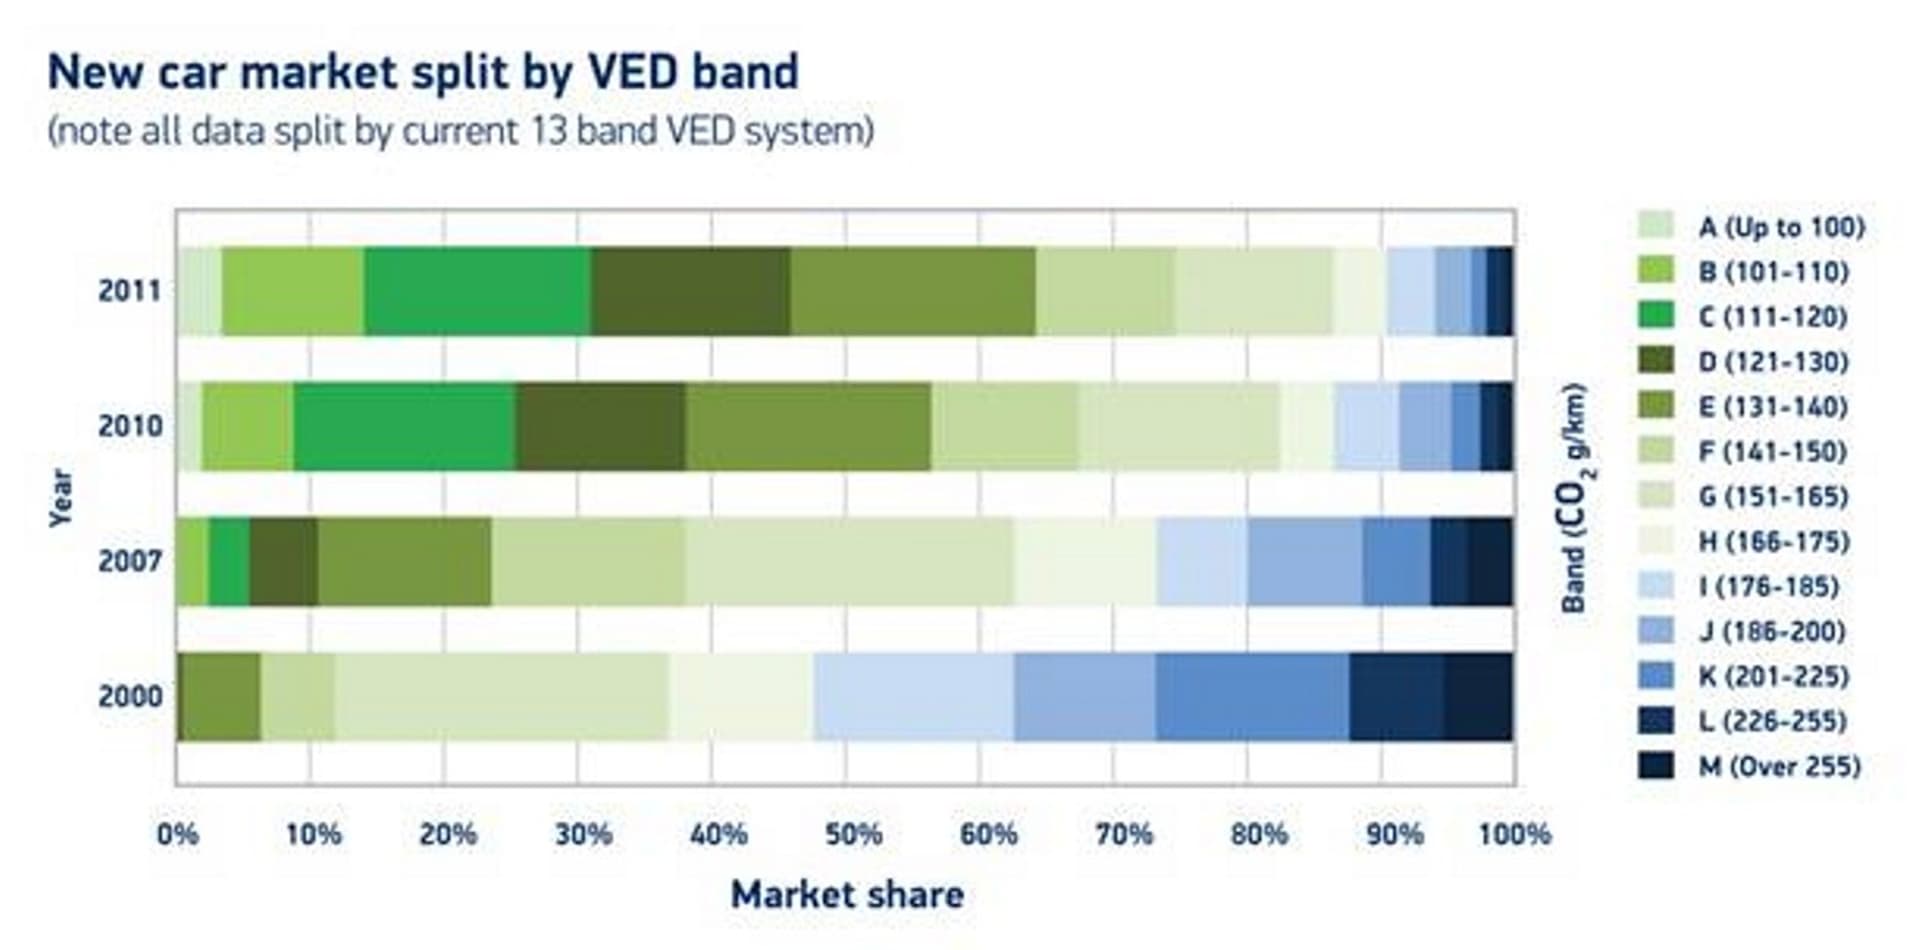
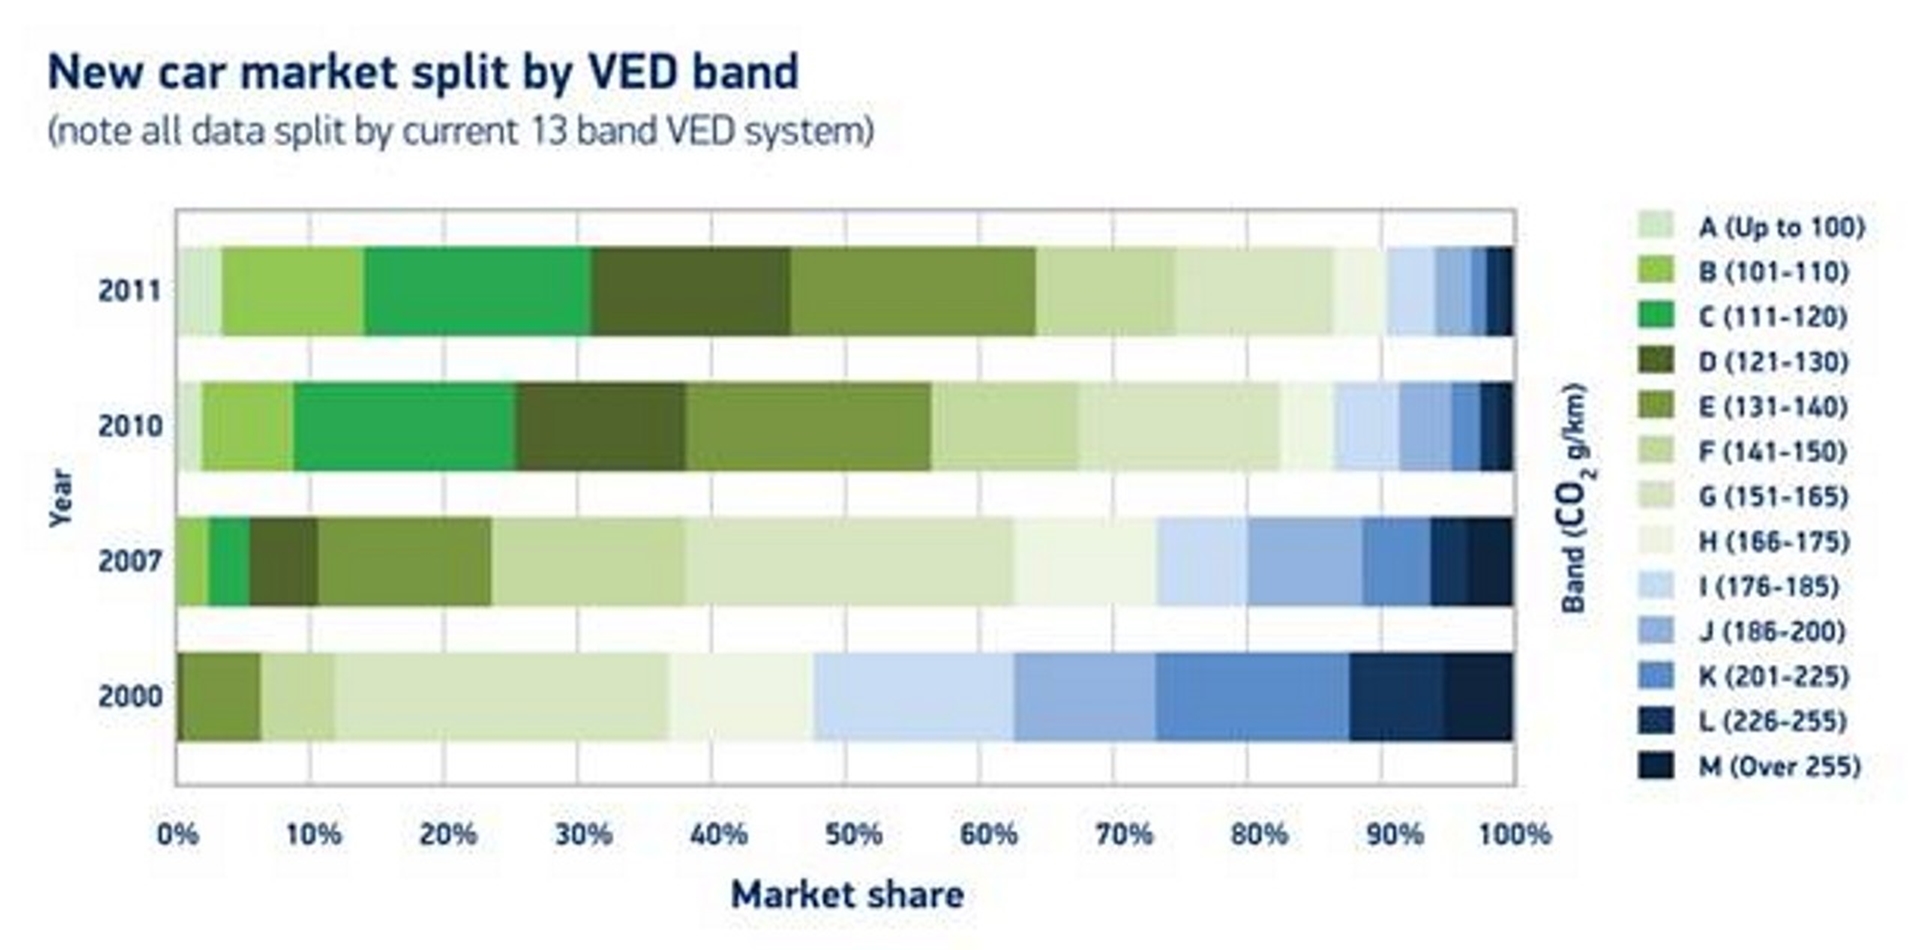
Motorists continued to seek out the most fuel efficient vehicles in 2011, as diesel car registrations overtook petrol for the first time taking a 50.6% market share. The growing trend of diesel registrations, coupled with the increasing share of alternatively-fuelled vehicles, resulted in there now being fewer petrol cars on the road than at any time since 1988.
With fuel efficiency at the front of every motorist’s mind, it is no surprise to see the number of tax-free cars on the road double since last year to more than 120,000 vehicles (cars emitting under 100g/km CO2 pay £0 VED).
Top five most popular cars on UK roads
-
Ford Focus
-
Ford Fiesta
-
Vauxhall Astra
-
Vauxhall Corsa
-
Volkswagen Golf
Main growth segments over last decade
| SMMT segment | Growth over last decade |
| MPV | 205% |
| Dual Purpose / 4×4 | 124% |
| Mini | 43% |
| Supermini | 34% |
| Specialist Sports | 27% |
Going for gold
In the race for gold, silver and bronze, Wales tops the podium boasting the largest proportion of gold cars. Silver is the UK’s number one colour, but the North West has the biggest share, while the roads of the West Midlands have the greatest proportion of bronze cars.
| Top five colours in 2011 | Top five colours in 2002 | ||||||||||||||||||||||||||||||||||||
|
|
Why Wight is red
The Isle of Wight is the most popular place in the UK for red cars, but the colour’s popularity has tumbled since peaking in 1999 when 25% (6.7 million) of all cars across the country were red. Today, just 12% of motorists favour the colour with Londoners leading the trend away from red, representing just 9% of the city’s cars.
Through its Motorparc database SMMT can analyse historical records of more than 200 million vehicles, looking at over 80 categories, each broken down by region, town or even postcode. This record of the past, combined with current records covering 31 million cars and 4.3 million commercial vehicles, makes the service one of the richest data sources in the industry. More information about SMMT’s Motorparc and new vehicle registrations data services can be found at
www.smmt.co.uk/data
.
Greatest regional CO2improvements
| Region | 2011 parc CO2 | % change vs 2006 |
| Bracknell Forest | 161 | -21 |
| Slough | 149 | -20 |
| Milton Keynes | 160 | -18 |
| Swindon | 157 | -17 |
| South Gloucestershire | 160 | -16 |
| Shetland Islands | 159 | -15 |
| Bedford | 166 | -15 |
| Warwickshire | 167 | -15 |
| City of Portsmouth | 160 | -14 |
| Glasgow City | 157 | -13 |
| Region | g/km CO2 |
| Slough | 149 |
| Swindon | 157 |
| Glasgow City | 157 |
| Shetland Islands | 159 |
| Milton Keynes | 160 |
| South Gloucestershire | 160 |
| City of Portsmouth | 160 |
| Darlington | 160 |
| Bracknell Forest | 161 |
| West Midlands | 161 |
About SMMT Data:
SMMT holds data on all 35 million vehicles on the road in the UK and circa 2.5 million new cars, vans, trucks, buses and coaches sold each year. The historical data covers in excess of 200 million vehicle records. The ever-expanding SMMT vehicle databases can analyse vehicle information across more than 80 data fields, both nationally and regionally, from monthly registrations and CO2 output, to vehicle model, age, weight, colour and engine characteristics. SMMT supplies data to the motor industry, government, consumer bodies, other businesses and websites. By working with strategic partners, SMMT can analyse almost any trend, focus on any issue and answer any question about vehicles in the UK.
Comments
Newest firstLoading comments…