



SMMT BUS AND COACH INDUSTRY NEWS
- Registrations of purpose-built buses and coaches grew 5.1% in 2011, the whole market was up 4.3% in December, but 12.8% down for the year.
- 2011 was a challenging year for the bus and coach sector despite positive performance in December:
- Bus registrations rose 0.5% in December, but finished the year 13.6% down.
- Coach volumes were up 88.2% but dropped 7.1% over the 12-month period.
- December’s overall bus and coach volumes were up 4.3%, but down 12.8% for the full year.
“Throughout 2011 it has been the purpose-built bus and coach sector that has shown most resilience to challenging market conditions ending the year up 5.1% on 2010,” said Paul Everitt, SMMT Chief Executive. “Elsewhere in the sector, while heavy bus and coaches fared best, the lighter and converted end of the market struggled to maintain momentum. 2012 is set to be a testing year, but government incentives and operator desires to capitalise on fuel efficient technologies should provide much-needed stimulus to the market.”
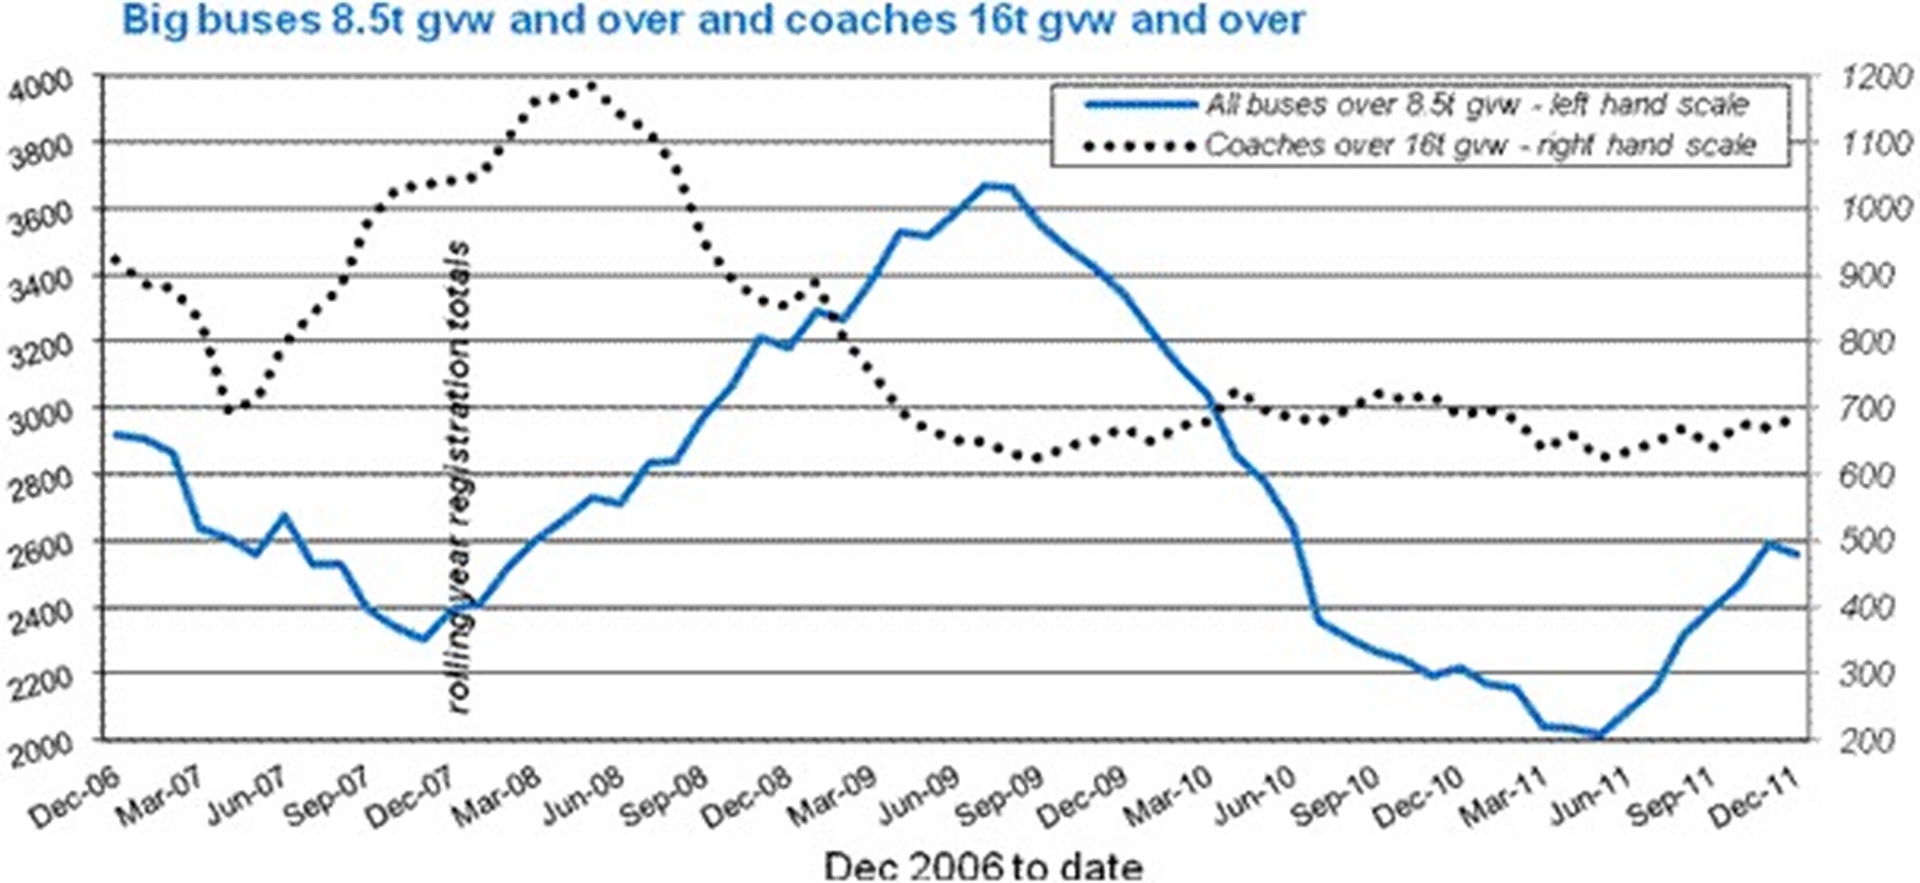
Big buses and coaches – rolling year registrations December 2006 to December 2011
December and full year 2011 new bus and coach registrations
| December | % change* | Year-to- date | % change* | Rolling year | % change* | ||
| Single-deck buses | Minibuses <= 3.5t | 65 | 30.0% | 555 | 52.1% | 555 | 52.1% |
| >3.5t to 8.5t | 160 | 10.3% | 2,162 | -38.6% | 2,162 | -38.6% | |
| >8.5t to 16t | 65 | -1.5% | 1,047 | 9.7% | 1,047 | 9.7% | |
| >16t | 24 | 0.0% | 235 | -25.4% | 235 | -25.4% | |
| Single-deck buses total | 314 | 20.3% | 3,999 | -22.4% | 3,999 | -22.4% | |
| >16t double-deck buses | 65 | -44.0% | 1,278 | 34.5% | 1,278 | 34.5% | |
| Buses above 8.5t | 154 | -15.4% | 2,560 | 15.4% | 2,560 | 15.4% | |
| All buses | 379 | 0.5% | 5,277 | -13.6% | 5,277 | -13.6% | |
| Coaches >3.5t to 16t | 4 | -20.0% | 75 | -42.7% | 75 | -42.7% | |
| Coaches >16t | 28 | 133.3% | 687 | -0.3% | 687 | -0.3% | |
| All coaches | 32 | 88.2% | 762 | -7.1% | 762 | -7.1% | |
| Total buses and coaches | 411 | 4.3% | 6,039 | -12.8% | 6,039 | -12.8% |
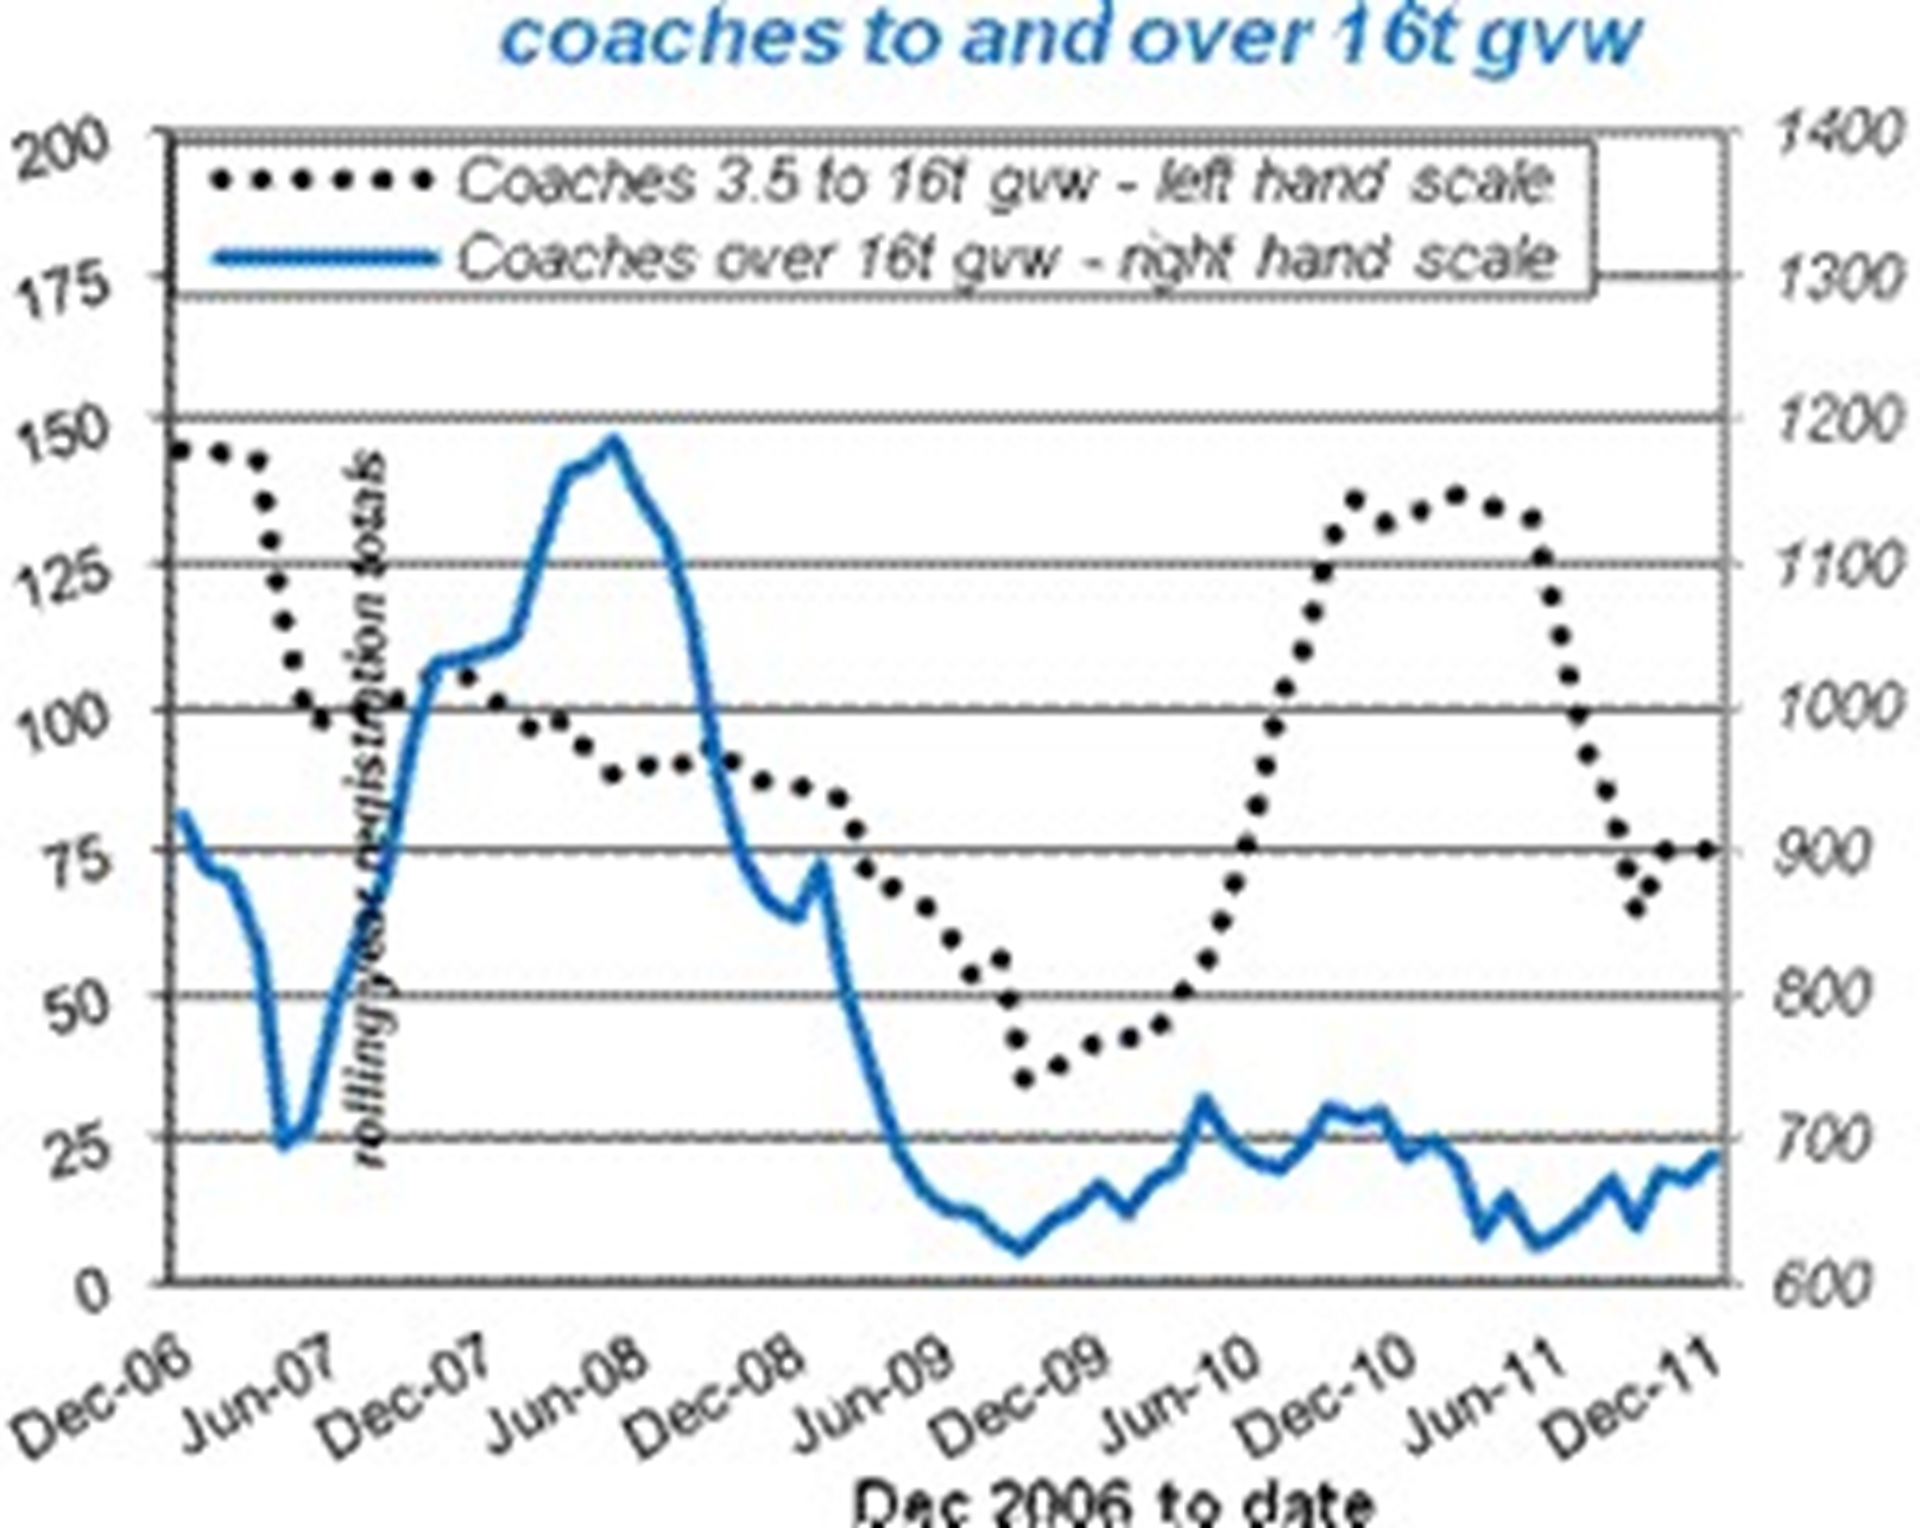
The tables and charts below detail annual trends by gross vehicle weight and type.
Annual trends – rolling year totals from December 2006 to December 2011.
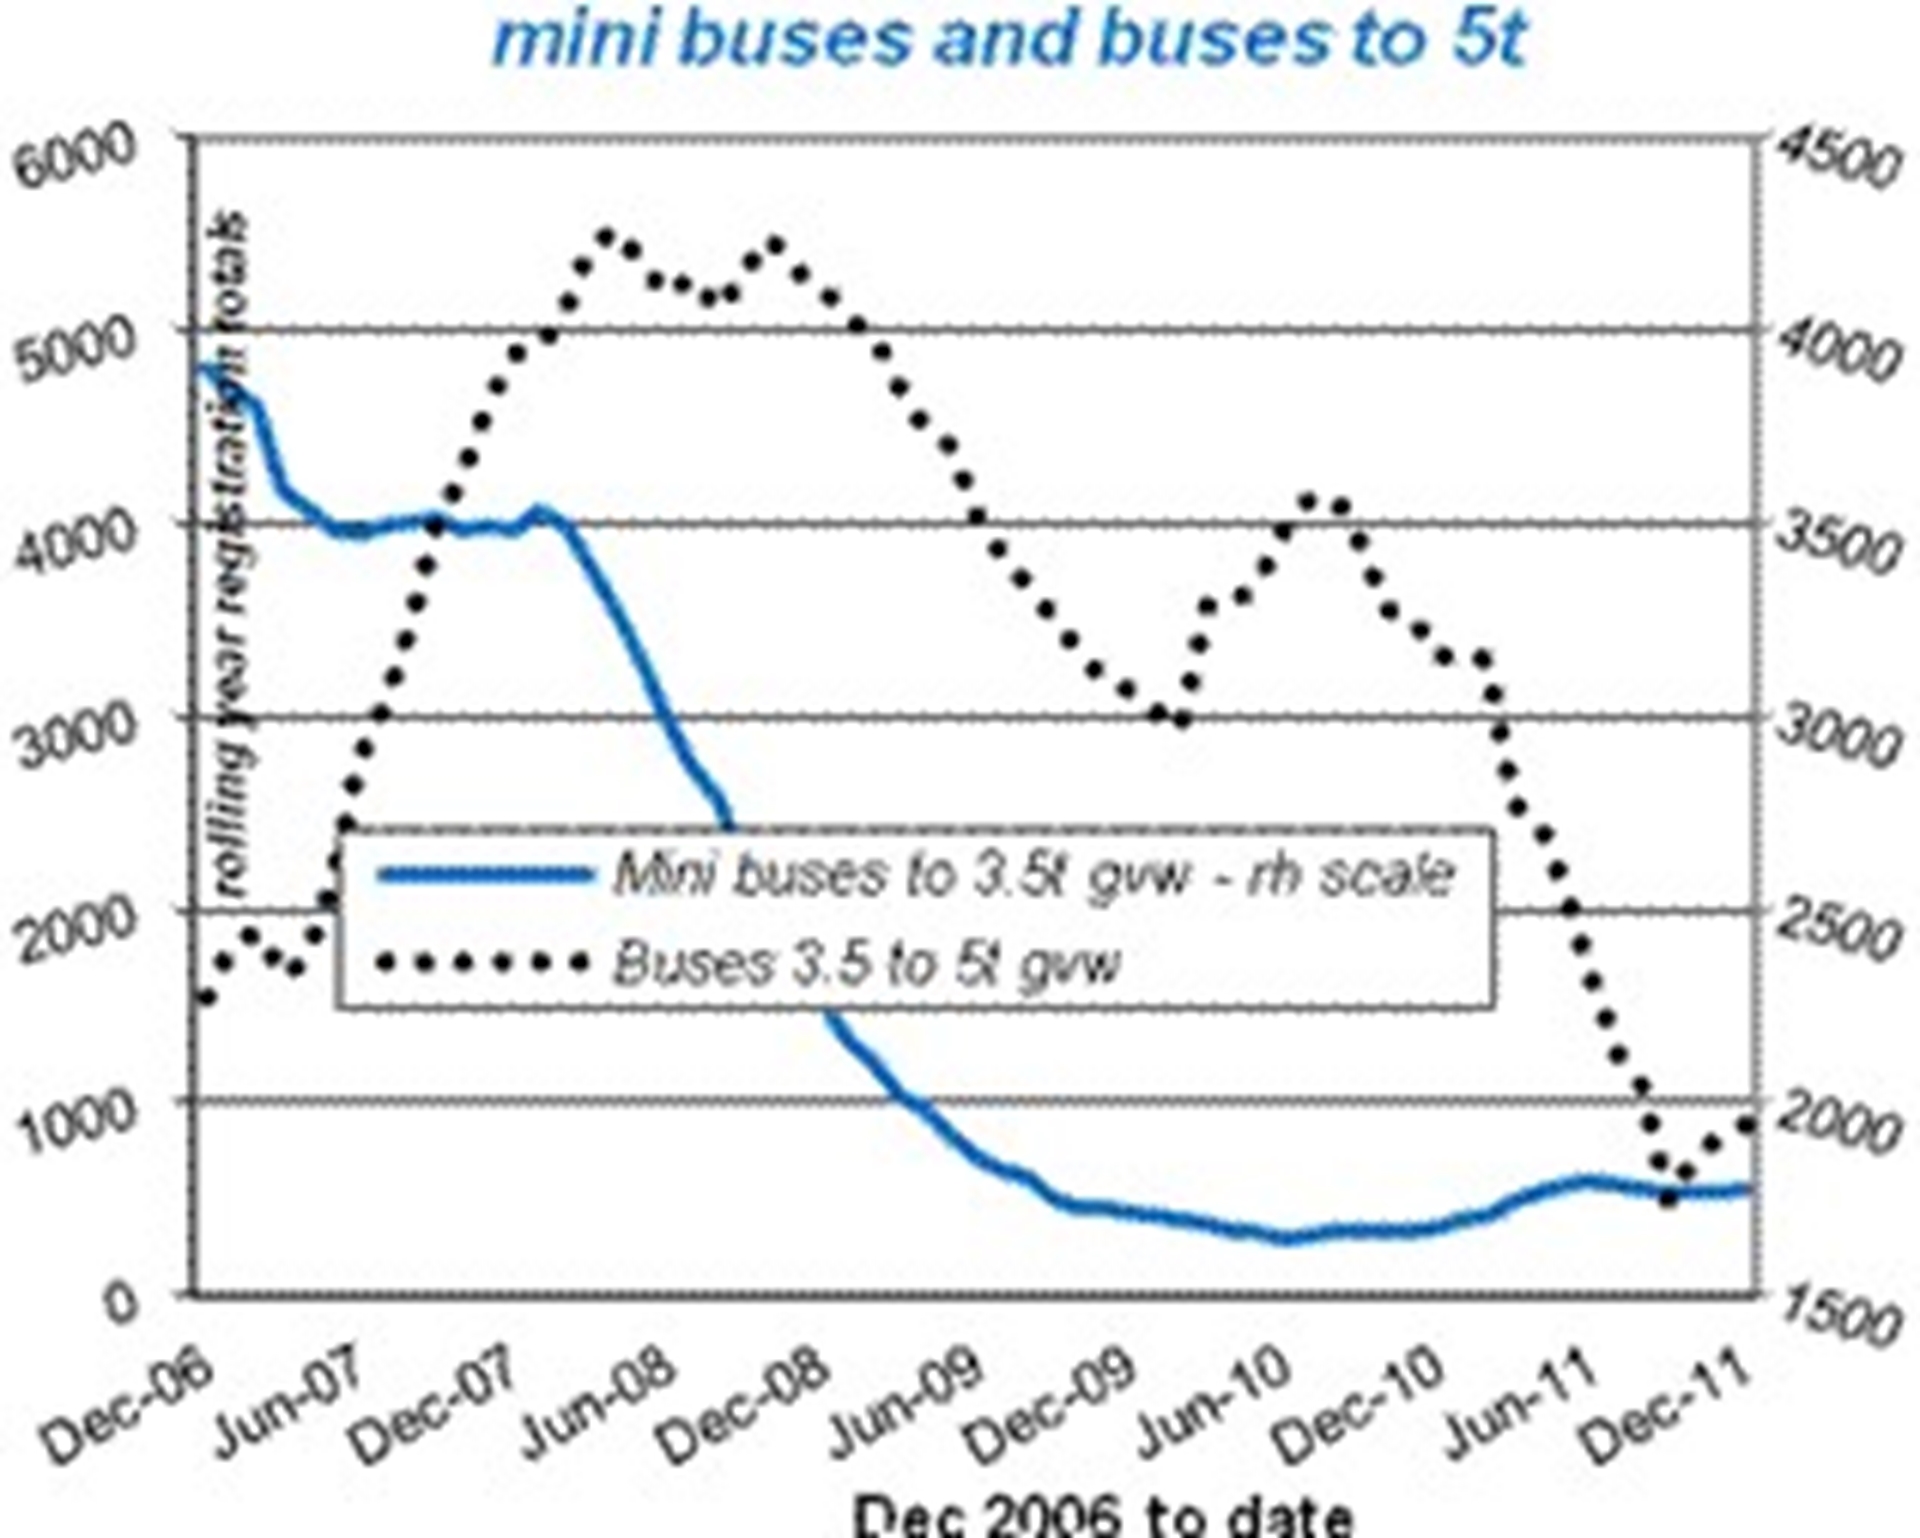
Mini Buses and Buses to 5t
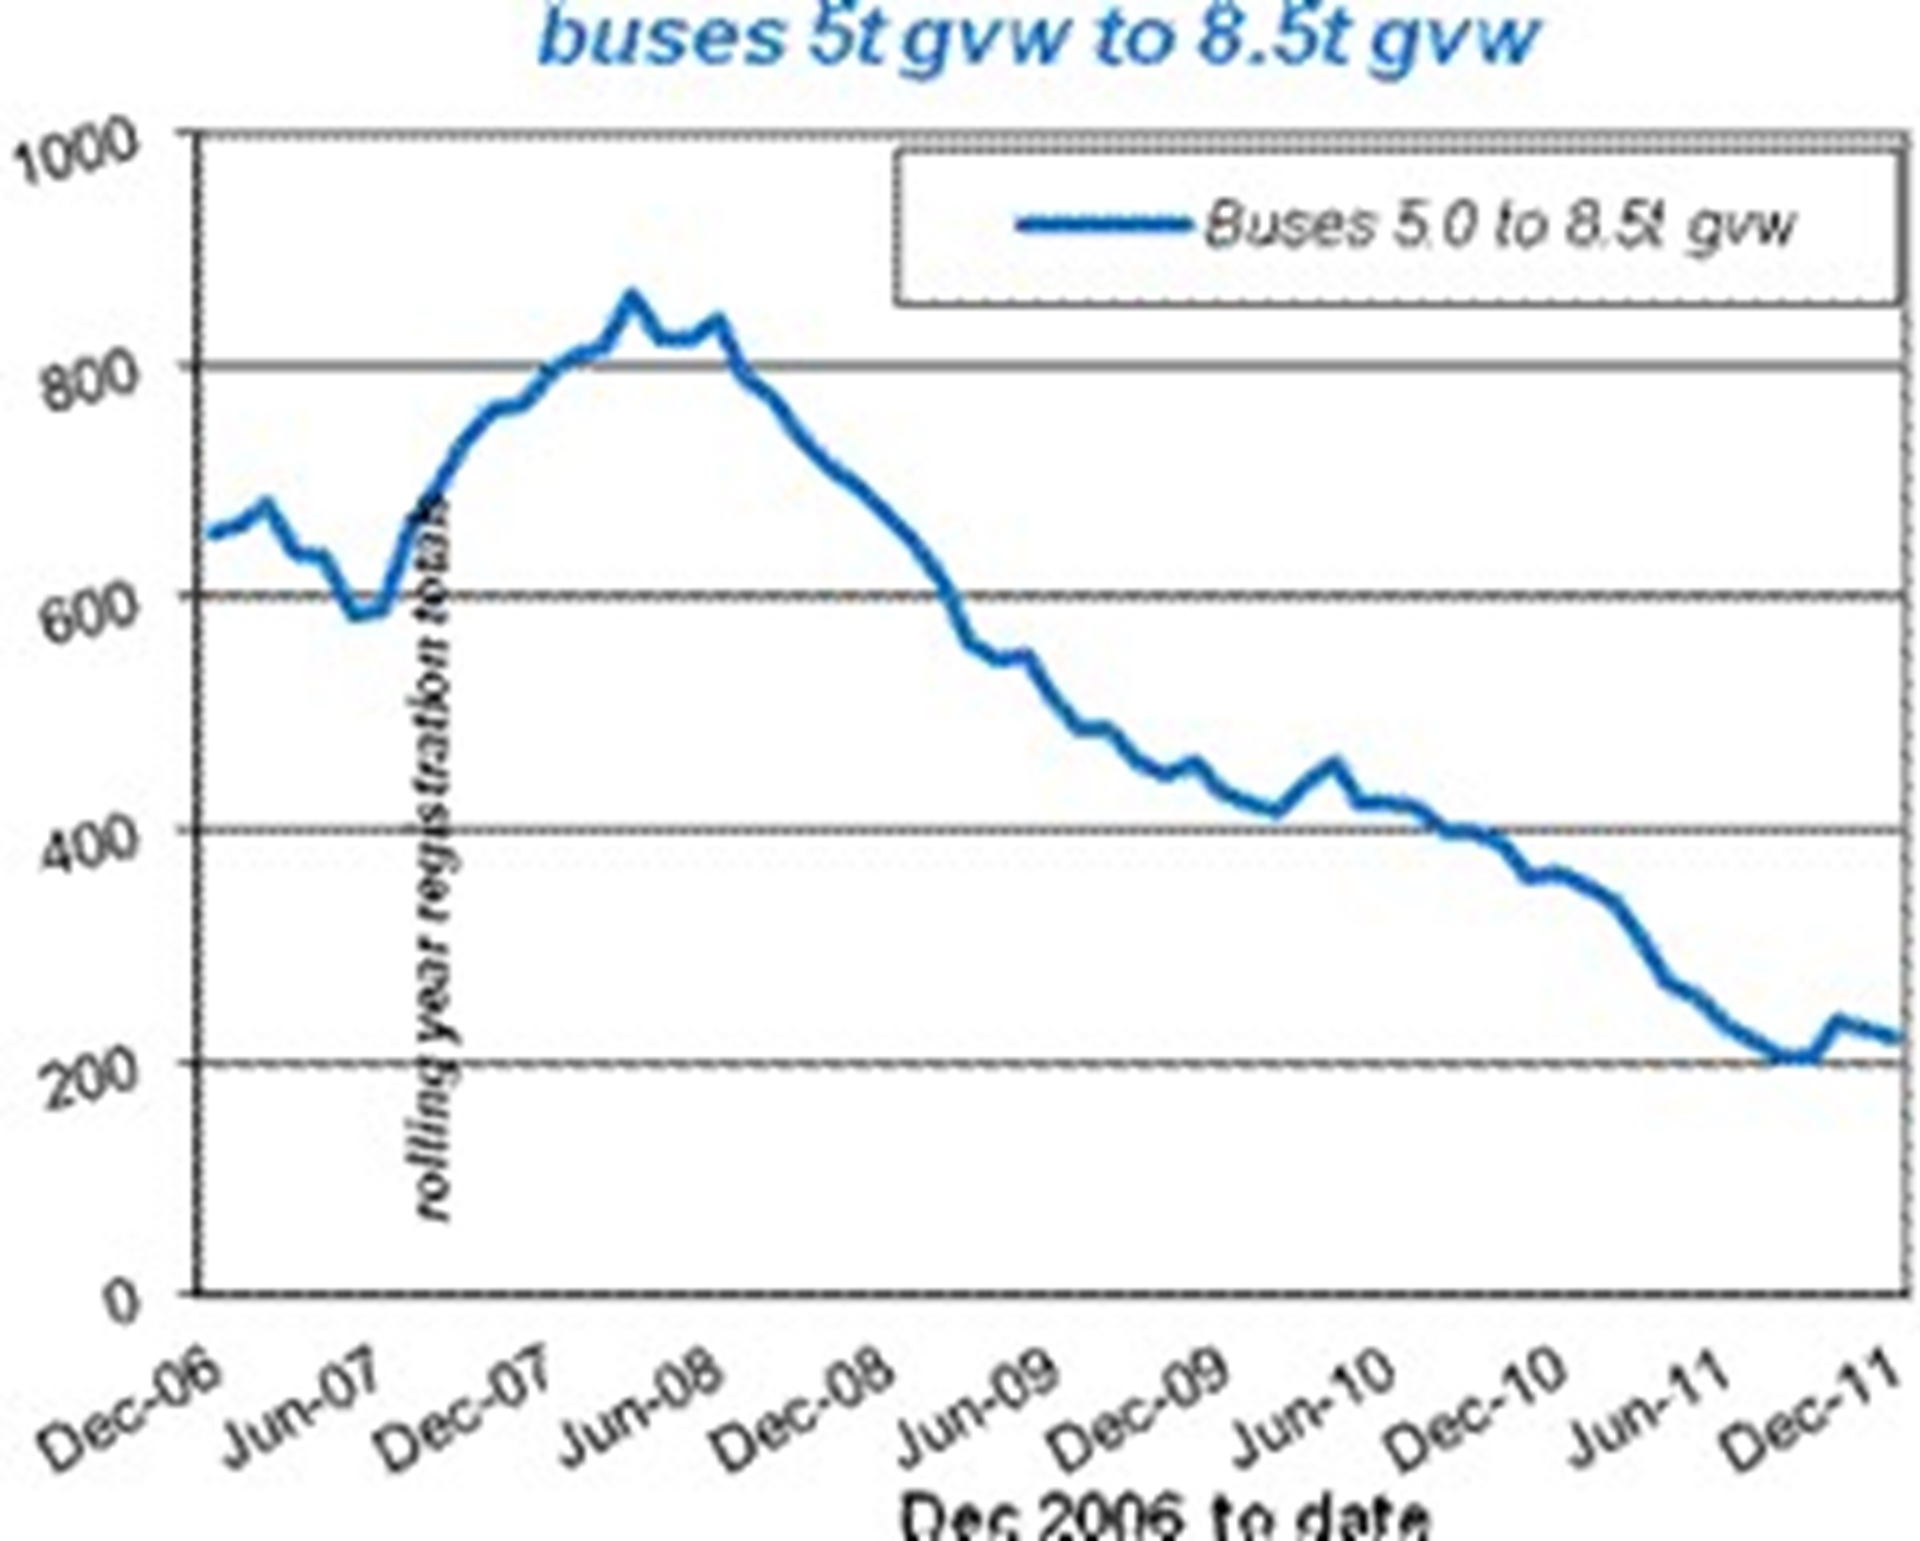
Buses 5t
Couches
Comments
Newest firstLoading comments…